When I started coding in professional organisations in the mid-2000s thick clients was the standard. Companies were producing mostly Java, .NET or C++ deliverables that had to be installed over sometimes thousands of machines. I had the chance to witness the shift to thin clients, enabled as it was by the rise of the Internet and modern web browsers such as Mozilla, Safari, Chrome, Opera, and others.
JavaScript became more and more important over the years, until it reached the level of professional enterprise applications we see today all over the place. In becoming critical to systems, the language called for proper supervision from technical teams… And I think everybody will agree to say that JavaScript went popular so fast that it was not ready to provide proper supervision.
Maintaining complex software is almost impossible without good tracking of all errors and events. So we’ll share in this article what are the best practices to generate JavaScript errors and logs, and get a better control over the operations. We’ll later explain how you can go further by contextualising and centralising them to dedicated tools.
1. JavaScript errors logging today
A) Reactive handling of errors
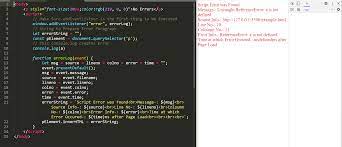
Cover the basics by listening to window.onerror()
The main way to catch errors in a web browser is with the window.onerror() method, which has been around for a while now and is still one of the easiest way to log client-side errors.

window.onerror = function (msg, url, lineNo, columnNo, error) {
// … handle error …
return false;
}
When an error happens, you’ll thus get the message, the url of the script in error (eg /dist/my_app.js), the line & column number in the script as well as an error object if available.
The error object usually comes with a stack trace – at least with every modern browser. So depending on the browser used, the attribute is not necessarily populated… and for those who do, the catch is that formats change. And it can get very annoying as the same error looks different when 2 users have different clients.
Chrome makes it look like this:
Error: foobar
at new bar (anonymous:241:11)
at foo (anonymous:245:5)
at callFunction (anonymous:229:33)
While IE 11 provides us with the following information:
Error: foobar
at bar (Unknown script code:2:5)
at foo (Unknown script code:6:5)
at Anonymous function (Unknown script code:11:5)
Fortunately, some pretty good open source projects were born to deal with this standardisation issue. If you want to normalize errors TraceKit is probably one of the best ones, and we’ll see how to use it.
Catch missing JavaScript errors arguments with try/catch
Here comes catch n°2 with Window.onerror(): different browsers give you back different numbers of arguments when they catch an error. Which means you’ll be missing some information about errors when investigating them if you do not do anything about it.

To make sure to get all the error information you need, you can catch the errors yourself with try/catch blocks everywhere. Once again, TraceKit is a good way to go. Proceed as follows:
try {
/*
* your application code here
*/
throw new Error(‘oops’);
} catch (e) {
//error with stack trace gets normalized and sent to subscriber
TraceKit.report(e);
}
It is kind of burdensome to implement everywhere, but it really is a best practice for coders to be consistent in their work, especially while working with a language that tolerates so many different ways to do the same thing.
B) The limitations of console logging
Console logging events has become a standard when it comes to understanding locally what a script is doing. Developers do so all the time, neatly sorting security levels as DEBUG, INFO, WARN, ERROR, FATAL to easily notice what is going on (or so I hope).
While it is really useful to them during development, it does not make any sense to use it in production with actual users that do not access it. Tech teams are usually left investigating bugs on their user’s side with very little information to start with. We all know that emails and phone calls that simply state things like “it’s not working” or “I can’t log in to my account” are the standard rather than the exception. And so you’re left with trying to get some traces from them and try fixing it.

And even if you could access consoles in production, their ability to help you debug is limited as logs disappear when pages refresh (so… why generate them?). Plus it eats up resources. So isn’t there a better way to investigate errors, hopefully before too many users complain?
2. Towards pro-active handling of errors
So logging client-side errors is a necessity for performance, and there are several ways to do so. But being able to analyse your JavaScript logs quickly through faceted search, filters, tag sets, and custom dashboards and alerts is really what enables proper supervision and performance.
It is what allows you to act swiftly when an incident happens but also, and more importantly, they offer a clear view of what’s happening, and this is really what allows you to see the storm coming before it hits you:
Hence the success of log management tools over the past years, from the on-premise Splunk, to the open sourced ELK or cloud-based ones as we chose to do. Plus log management offer full visibility over every part of your stack. Having access in one place to HTTP and application servers, databases, operating systems, web fronts and mobile apps data greatly enhances capabilities to ensure performance to end-users. With a good logging strategy and proper tool, developers are able to track down all traces left by a user through various services.
A) Centralisation of events
The third party editor usually provides a client library that takes care of transmitting events. We open sourced the logmatic-js library which can be coupled with TraceKit for example. The tiny library is added on your web pages as follows (options expanded here…):
// Set your API key
logmatic.init('your_api_key');// OPTIONAL init methods
// add some meta attributes in final JSON
logmatic.setMetas({'userId': '1234'});// fwd any error using 'error' as JSON attr
logmatic.setSendErrors('error');// fwd any console log using 'severity' as JSON attr
logmatic.setSendConsoleLogs('severity');// resolve client IP and copy it @ 'client.IP'
logmatic.setIPTracking('client.IP');// resolve client UA and copy it @ 'client.user-agent'
logmatic.setUserAgentTracking('client.user-agent');// resolve URL and copy it @ 'url'
logmatic.setURLTracking('url');// Default bulking setting - OPTIONAL modifications allowed
logmatic.setBulkOptions({ lingerMs: 500, maxPostCount: 10, maxWaitingCount: -1 })
The library is added and enabled on your web pages and directly optimizes the number of calls fired to the API, entries by default being bulked together every 500 ms or each time 10 of them are collected. The API then receives that kind of JSON messages:
{"severity": "info",
"userId: "1234",
"name": "My button name",
"message": "Button clicked",
"url": "...",
"client": {"IP" : "109.30.xx.xxx",
"user-agent": "Mozilla/5.0 (Macintosh; Intel Mac OS X 10_9_5) ..."
}
}
The normalized and structured message you then get is:
{"severity": "error",
"client": {"IP": "109.30.xx.xxx",
"user-agent": "Mozilla/5.0 (Macintosh; Intel Mac OS X 10_9_5)."
},
"message": "This is a fake error!!",
"userId": "1234",
"url": "../logmatic-js/test/test-client.html",
"error": {"mode": "stack",
"name": "Error",
"message": "This is a fake error!!",
"stack": [
{"args": [],
"func": "bar",
"line": 32,
"column": 15,
"context": {},"url": "../logmatic-js/test/test-client.html"
},
{"args": [],
"func": "foo",
"line": 28,
"column": 9,
"context": {},"url": "../logmatic-js/test/test-client.html"
},
... And more...
]
}
}
You will find that log management platforms usually work naturally with JSON format and don’t require tedious configurations or parsers to provide faceted searches and all the troubleshooting help the technical team needs.
B) Adding as much context as you can thanks to JSON logging
JavaScript objects naturally come in JSON. It is a real advantage that should definitely be leveraged when logging as that makes it extremely simple to add contextual attributes and even metrics to any events generated. Adding context to JavaScript errors and events helps you not only in speeding up time resolution time, but also in:
- Providing a better and pro-active support to users
- Providing Real-Time User monitoring (RUM) ie performance from the user perspective
- Tracking usage: measure all the actions in your application so – why not? – you can provide operational intelligence dashboards to business people
Adding context to all the logs
With logmatic-js there are 2 ways to do this, either during the initialisation by calling the setMetas() method during initialisation. To illustrate this, we did it in the previous section by setting the userId. But essentially you can provide as much information as you have such as the sessionId, the view, the name of the application, etc…
Adding context selectively
But you can also attach context while logging as we do here by providing the button-name:
logmatic.log('Button clicked', { button-name: 'My button name' });Wrapping up
Now that Javascript development has matured, developers need to find new solutions to ensure great performance of their applications. Setting up a logging strategy is but the foundation ground for performance considering that JavaScript errors and events are accessible only on remote clients. Capturing your Javascript errors and logs in log management tools that accelerate your troubleshooting is now critical when stakes are getting higher. So pump up your Javascript logging skills to the next levels and discover how much clearer the view is!


