Advanced Targeting With Google Analytics Interest And Demographic Reports.
Google has recently added some pretty awesome new reports to Google Analytics. You may or may not have noticed this, but you can now drill down deeper into information about your website visitors.
I’m talking about the new ‘interest and demographic’ reports that allow you to see data, such as the age, gender and interests of your visitors. Pretty great, right?
Before I go into how you can make use of this data, you need to make sure that you’ve updated the Google Analytics tracking code that is on your website to ensure that you can gather this extra data. It’s really simple to do, so I’ll quickly show you.
Updating Your Google Analytics Tracking Code
The first step is to go into Google Analytics (duh) and navigate to your website’s profile. Once you’re there, click on Audience > Interests > Overview. You’ll then be presented with this message:
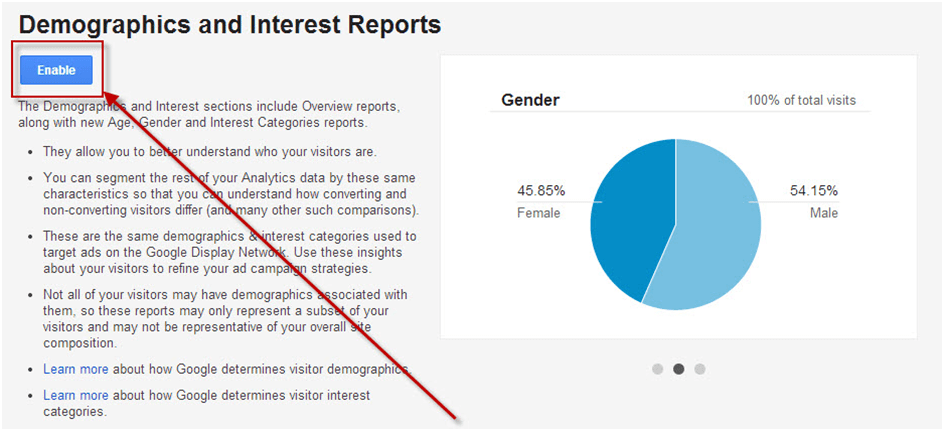
You need to click the ‘enable’ button.
Once you’ve done this, Google will ask you to update your tracking code (that’s placed within your website’s code). This is a really small change that you need to make, so don’t worry if you’re not the most code-savvy.
If you haven’t got the universal tracking code installed on your site at the moment, then you’ll need to do an extra step. To find out if you have, click on ‘Admin’ in the top right of your screen and click on Tracking Info > Tracking Code under the ‘Property’ column.
If you haven’t installed the universal tracking code, you’ll be presented with this message:

You can then click on ‘Universal Analytics Upgrade’ to begin the process of transferring to the new tracking code (as shown below):
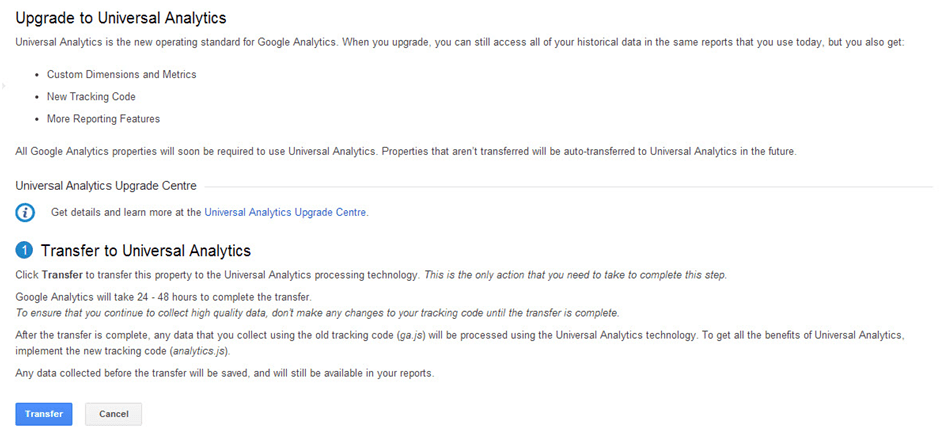
One thing to note here is that it usually takes about 24-48 hours to update, and then you’ll have to add the new tracking code to your website. Also, you won’t lose any data during this time, so don’t worry.
Once you’ve successfully upgraded, or if you didn’t need to upgrade, you’ll need to install the tracking code that will gather extra demographic and interest data from your visitors.
This couldn’t be easier. Simply go back to the Tracking Info > Tracking Code tab (under the ‘Property’ column within the admin area) and then copy your updated tracking code and paste it into the <head> section of your website.
UPDATE: As the new Universal Analytics code doesn’t support the use of dc.js (the script used for remarketing, interests and demographic data, etc.), you will have to manually add this.
Again, this is really simple and you just need to change one line of code. Read exactly how to do this here: https://support.google.com/analytics/answer/2444872?hl=en-GB&utm_id=ad
Note: If you use a third-party plugin to dynamically pull in your Analytics code to your website, then this should be done automatically.
The final stage is to go back to the Interests and Demographics section within your website’s Google Analytics reports and click on the button that says ‘Validate Tracking Code’.

If all goes to plan, you will start gathering extra information on your visitors from this point forward.
Note: If you’re using a third-party plugin to handle the Analytics code being placed on your site, then you may find that you get a message saying that the code couldn’t be validated. If this is the case, press ‘Skip validation’ and it will start working.
After a little while of gathering data, you should have a fancy report that looks something like this:

One other thing that’s worth mentioning at this stage is the data ‘thresholds’. Google doesn’t gather data from every single user, and you may find that you receive limited amounts of results due to this.
Google states on this Adwords Support thread that:
“When someone visits a website that has partnered with the Google Display Network, Google stores a number in their browser (using a “cookie”) to remember their visits. This number uniquely identifies a web browser on a specific computer, not a specific person. Browsers may be associated with a demographic category, such as gender or age range, based on the sites that were visited.
In addition, some sites might provide us with demographic information that people share on certain websites, such as social networking sites. We may also use demographics derived from Google profiles.”
So just be aware of this.
Using the New Interest and Demographic Reports
Here’s where we get into the fun stuff. The new reports give us a wider scope to understand the types of users that come to our website. This gives us more data to use within our marketing.
Through using this intelligence, you can ensure that you are able to dramatically improve the effectiveness and efficiency of the methods that you use to both create and promote your content. This is exactly what I’ve been doing recently within Find My Blog Way and continue to do for my clients’ websites.
Identifying Your Most Engaged Audience
Newsletter subscriptions, PDF downloads and affiliate link clicks are three of my major conversion metrics for Find My Blog Way (amongst many others). Combining these metrics with the new interest and demographic reports in Google Analytics has allowed me to identify the group of users that convert best on my blog.
Just check out the chart below:
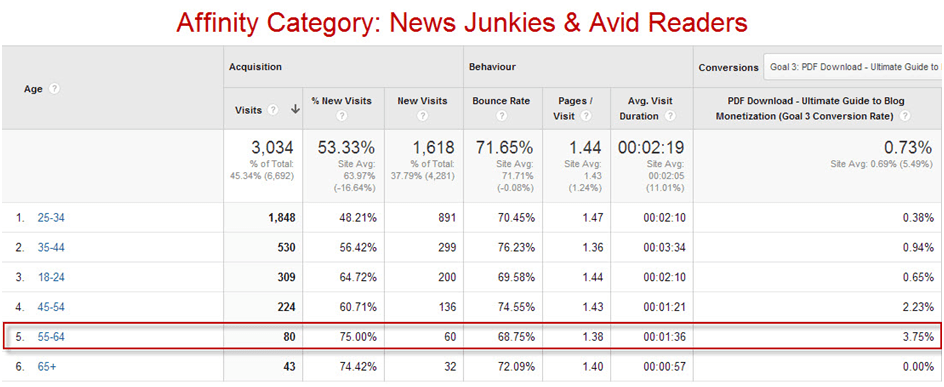
This chart shows the stats from the past 30 days on readers of my blog that fit within the ‘News Junkies and Avid Readers’ affinity category. The users within this category have the highest conversion rate of any on my site.
On top of this, I can drill down deeper to find that the users between the age range of 55-64 seem to convert best at downloading my PDFs and signing up for the newsletter. This isn’t the kind of results that I was expecting, as most of my content was aimed at the 25-34 age range (which actually isn’t converting very well within this segment).
An even bigger surprise was that, overall, visitors within the age range of 45-64 converted into newsletter subscribers way better than the younger age ranges (see below):
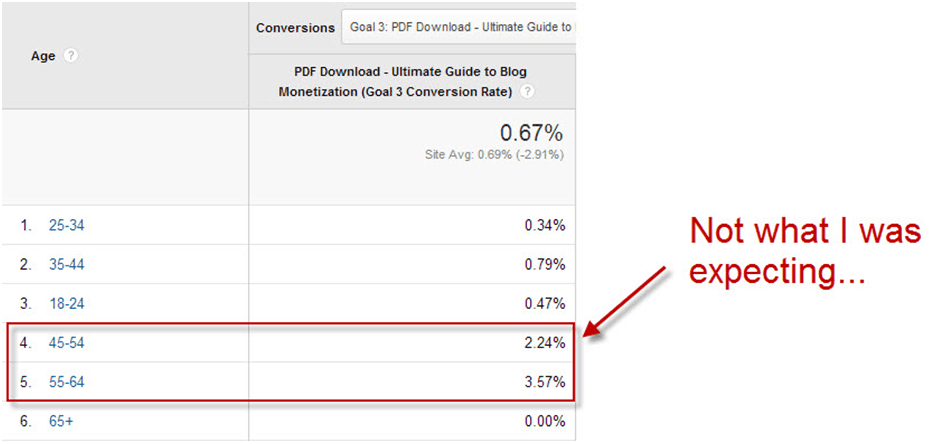
Maybe it’s time to start rethinking my targeting? Or maybe it’s time to start finding out which type of content the younger audience would prefer to see more of.
Finding Which Type of Content Is Popular with Each Segment
Another way that I’ve been using these new reports is to find out what type of content each of my different user groups prefers. This way, I can ensure that I’m promoting the right content to the right audience.
To start with, I’ve found the segment of users that most regularly visits my blog. This is made up of 24-35 year old males within the ‘Technophiles’ affinity category. I can now set up an advanced segment within Google Anlaytics to filter down into the stats of these users.
To do this, just navigate to the Audience > Overview report and click the little downward-facing arrow above the visitor graph (see below):

Now, click ‘Create Segment’ and you can start filtering down on the type of users you want to see data for.
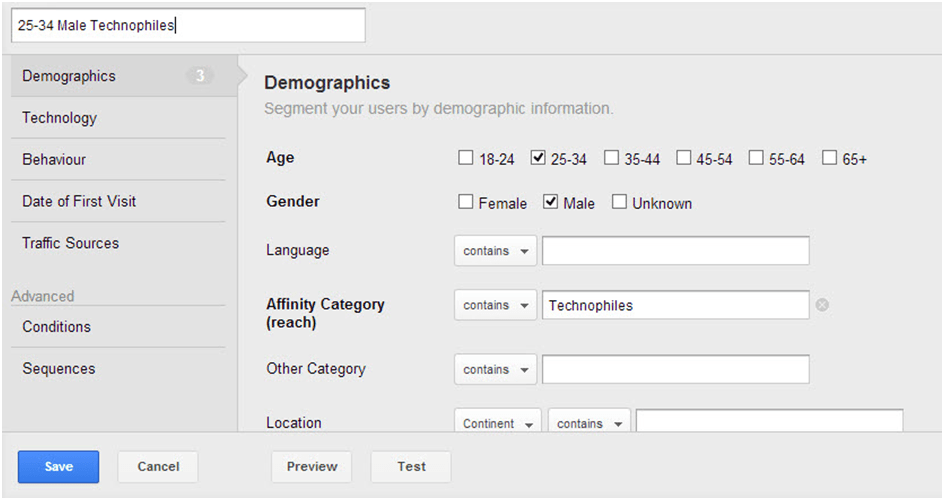
Now that I have my advanced segment set up, I can take a look at the stats on the different content of the blog. To do this, navigate to Behaviour > Site Content > All Pages.
I’m now looking for the content that my target users are most engaged with, so I’ve sorted the pages by ‘Average Time on Page’.
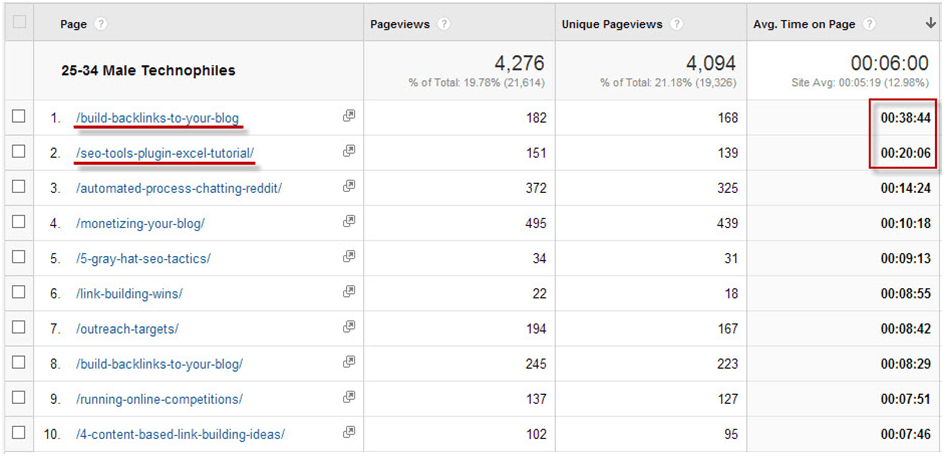
From this, I can see that my most engaging content for this segment is my SEO tutorials, with the post I wrote on building backlinks to your blog ranking highest, closely followed by my SEO Tools for Excel plugin tutorial.
On top of this, I can find out which types of content bring the highest conversion rate on the site, which will help me to target content to my audiences in order to build out my mailing list, encourage affiliate clicks, etc.
This is only really the tip of the iceberg regarding what you can find from these new reports, but it’s an extra step in the direction of truly understanding what your different users like and respond to.
Using this Data within Your Advertising
One of the ways that I’ve been using this data to my advantage has been within any of the paid promotions that I’ve done for my content.
Considering that most social advertising platforms allow you to target users by demographics and interest (for example, StumbleUpon Paid Discovery and Facebook Advertising), it seems to be a no-brainer to tie this data into it.
I actually used this approach with my latest ‘Ultimate Guide to Blog Monetization’, which I promoted heavily through StumbleUpon Paid Discovery.
From my analysis, I found that the 25-34 age range responded very well to this type of post and tended to convert into newsletter subscribers as a result. In particular, it was males that had a passion for tech, gadgets and consumer electronics.
With this in mind, I targeted that exact group within StumbleUpon, and my efforts resulted in a conversion rate of just over 3% – a big increase on my site average!
TL;DR
- Set up your Google Analytics tracking code to pull in data around the demographics and interests of your users.
- Use this information to understand which types of users prefer which type of content that you produce.
- Use paid social media advertising to bring in visitors directly within high-conversion groups in order to maximise engagement on your content.

