Everything you Need to Know about AWS Logging
Amazon Web Service has been offering ever more options over the years, starting by the famous “EC2” one. So if you’re hearing everyday about “Lambda”, “ELB”, “S3”, “CloudFront”, “CloudWatch”, “VPC”, “CloudTrail” or “RDS”, this blogpost is for you. We’re going to cover how to find the AWS logging information you need to understand what’s happening in your AWS layers.
As cloud applications get more and more distributed, the need to centralize information in a single place, or at least to get a good understanding about where to access the right information has become critical. The variety of AWS services makes it even slightly more complex.
So I’ve decided to share my experience in the AWS logging landscape here. It’s quite a long read, but I believe you’ll really find it worth your time. Anyway, should you wish to jump directly to the AWS logging section that matters the most to you, here is the table of contents:
I. Starting from the beginning with EC2 logging
II. AWS logging backbone: S3
III. ELB (Amazon Elastic Load Balancing) logging
IV. Audit logs with AWS Cloudtrail
V. CloudFront – The AWS’ CDN
VI. Amazon CloudWatch logs
VII. Other AWS services you can get logs from
I. Starting from the beginning with EC2 logging
1) Looking into applications and system logs
With Elastic Compute Cloud you can run your application and create all the Virtual Machines you need at any given moment, of any size and with any operating system.
Everybody knows that application logs really matter to help Ops and Devs troubleshoot or understand what’s going on. When facing machines in the dozens with several apps deployed on each of them, searching logs is time consuming. That’s when centralizing all of them in a single place becomes a requirement. Your boss will probably not appreciate you having fun with ssh + tail / grep during an incident.
System logs come from all the processes that run in the Virtual Machine’s Operating System itself. It tells you who connected or tried to connect to your machine, all kernel warnings, periodic jobs, etc… Performance or functional issues can also come from theses layers. Collecting those logs aside from application logs is usually fairly easy.
2) Centralizing EC2 logs
There are many ways available to centralize your EC2 logs. When issued from your own apps, it can directly be collected from the logging SDKs thanks to a remote syslog connection for instance. We call this method “agentless”. We’d rather encourage you to use more reliable and proven methods that rely on log shippers though. Log shippers are efficient, handle network disconnections, are able to tail and stream files in real-time, and finally, provide you with a structuring format. Here is a list of available log shippers for:
- Linux: Rsyslog usually comes as the default logging system. Syslog-NG is another one that usually brings more features. Both collect all system logs by default, and configuring them to collect data from your own application files is easy.
- Windows: NXLog is really reliable and comes with a lot of configuration possibilities. Writing in Syslog formats is one of these and is pretty useful if you centralize logs from various Operating Systems.
Logstash and FluentD are also good candidates. I personally believe they don’t bring much value compared to the one listed above. Plus they force you to work with their own standards.
Now that you get a sense of how to collect those valuable logs from both applications and VMs, let’s have a closer look at what other AWS services can provide you with in terms of logs, and at how to extract them as well.
II. AWS logging backbone: S3

Considering that Amazon is trying to take full advantage of its services, and that getting data out of AWS is not free, they decided a couple of years ago that S3 would be the perfect recipient for most logging cases.
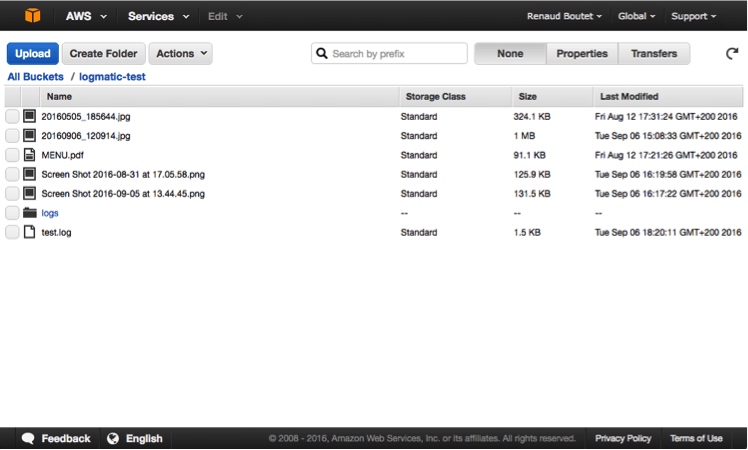
The aptly named S3 for “Simple Storage Service” can pretty much store any amount of data. It is very often used to expose assets like static pages or images over the Internet as well. Assets are located in a Bucket (main folder) and can be found thanks to their Key (path):
Let’s now get a closer look at how AWS is using S3 as a log container by studying how AWS provides… S3 access logs… 🙂
1) Our first log source: S3 Access Logs
S3 access logs record every access from a S3 bucket. Bucket logging is the process in which the operations performed on the Bucket will be logged by Amazon. Users operations can be one of the following: upload, download, share, access, and publication of contents.
2) Why does it matter?
S3 bucket logging is the proof for all activity that has been conducted over a bucket. It tracks these operations as well as which user did them. So you can:
- Track suspicious activities
- Know which files are the most accessed
- Calculate used bandwidth
- Troubleshoot access errors (wrong access, 404s, etc…)
- Track user agents (actual users, mobiles?, bots, etc…)
3) Enable S3 logging & format
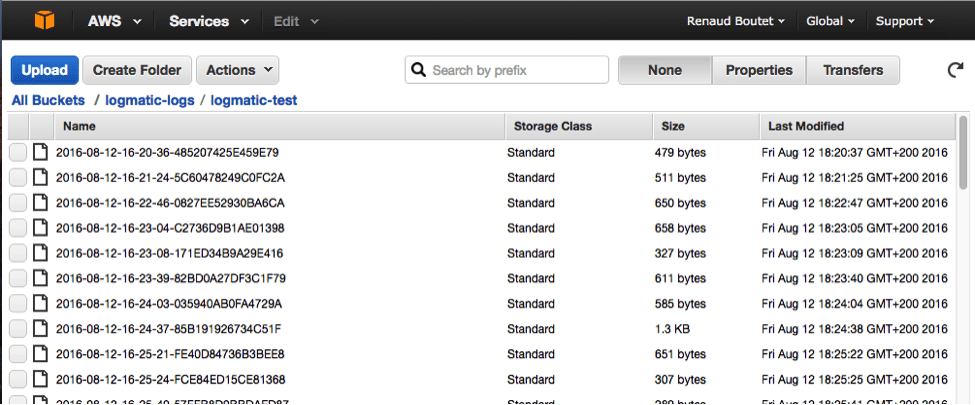
To enable bucket logging, go on a bucket and turn logging on: you can choose the target bucket in which logs will be delivered. A target bucket would be different from the logged bucket.
Logs are delivered in multiple files with the following name:
TargetPrefixYYYY-mm-DD-HH-MM-SS-UniqueString
Which contains data formatted as follows:
Bucket_Owner Bucket Time Remote-IP Requestor Request-Id Operation Key Request-URI HTTP_Status Error_Code Bytes_Sent Object_Size Total_Time Turn-Around_Time Referrer User-Agent79a59df900b949e55d96a1e698fbacedfd6e09d98eacf8f8d5218e7cd47ef2be mybucket [06/Feb/2014:00:00:38 +0000] 192.0.2.3 79a59df900b949e55d96a1e698fbacedfd6e09d98eacf8f8d5218e7cd47ef2be 3E57427F3EXAMPLE REST.GET.VERSIONING - "GET /mybucket?versioning HTTP/1.1" 200 - 113 - 7 - "-" "S3Console/0.4 4) How do you analyze them?
Unfortunately, both the format and the cheer number of hundreds of files makes it difficult for a human being to efficiently analyze them. We advise you to ship them out with an AWS Lambda function spawned by S3 events, and going one step further, to use a log analytics platform for more efficiency.
III. ELB (Amazon Elastic Load Balancing) logging
Elastic Load Balancing automatically distributes incoming application traffic across multiple Amazon EC2 instances. It helps you to handle faults in your applications, seamlessly providing the required amount of load balancing capacity needed to route application traffic.
1) What are ELB logs?
ELB provides access logs that capture detailed information about requests or connections sent to your load balancer. Each log contains information such as the time it was received, the client’s IP address, latencies, request paths, and server responses. You can use these access logs to analyze traffic patterns and troubleshoot issues. ELB publishes a log file for each load balancer node every 5 minutes. The load balancer can deliver multiple logs for the same period.
An HTTP entry looks like this:
2015-05-13T23:39:43.945958Z my-loadbalancer 192.168.131.39:2817 10.0.0.1:80 0.000073 0.001048 0.000057 200 200 0 29 "GET http://www.example.com:80/ HTTP/1.1" "curl/7.38.0" - - And A TCP entry like the following:
2015-05-13T23:39:43.945958Z my-loadbalancer 192.168.131.39:2817 10.0.0.1:80 0.001069 0.000028 0.000041 - - 82 305 "- - - " "-" - - 2) Why should you look at them?
Watching ELB logs will help you:
- Check if your services are correctly load balanced
- Measure your application performance from an external point of view
- Check suspicious behaviour from some IPs or User-Agents
- See the actual number of connections and identify peaks
- See how bots are crawling through your pages (for SEO purposes for instance)
- And much more
3) Enable S3 logging & analyze the data
AWS logging is coordinated around S3, and ELB is delivering its logs into S3 buckets in the same way as described in the previous section. While the names and content of delivered files change, the same principle applies: log entries are delivered by batch (in a file) and are appended in a target bucket.
To enable S3 logging see the following animated GIF:

Once again, because of the amount of data generated, if you are planning to get analytics out of your log entries, you should get them out. Please refer to our S3 Lambda python script documentation as a guideline.
IV. AWS Cloudtrail: audit logs
AWS CloudTrail is an audit service. Use AWS CloudTrail to get a history of AWS API calls and related events in your account. This includes calls made by using the AWS Management Console, AWS SDKs, command line tools, and higher-level AWS services.
1) What are cloudtrail logs?
Cloudtrail logs are also called Cloudtrail Records. Records come in JSON format and they look like the following:
{
"Records": [{
    "eventVersion": "1.01",
    "userIdentity": {
        "type": "IAMUser",
        "userName": "Alice",
        ...
    },
    "eventTime": "2014-03-18T14:30:07Z",
    "eventSource": "cloudtrail.amazonaws.com",
    "eventName": "StartLogging",
    ...
},
... additional entries ...
]
This example shows Alice who called the Cloudtrail `StartLogging` API from the console. You’ve probably also noticed that the file content can hold multiple entries, cf the `Records` array that starts the JSON document.
2) Why should you look at them?
As audit records they can be used when you need to understand who did what over your AWS infrastructure. It also helps you to check if the API callers (generally scripts right?) are doing what they are supposed to do.
3) Enable S3 logging & analyze the data
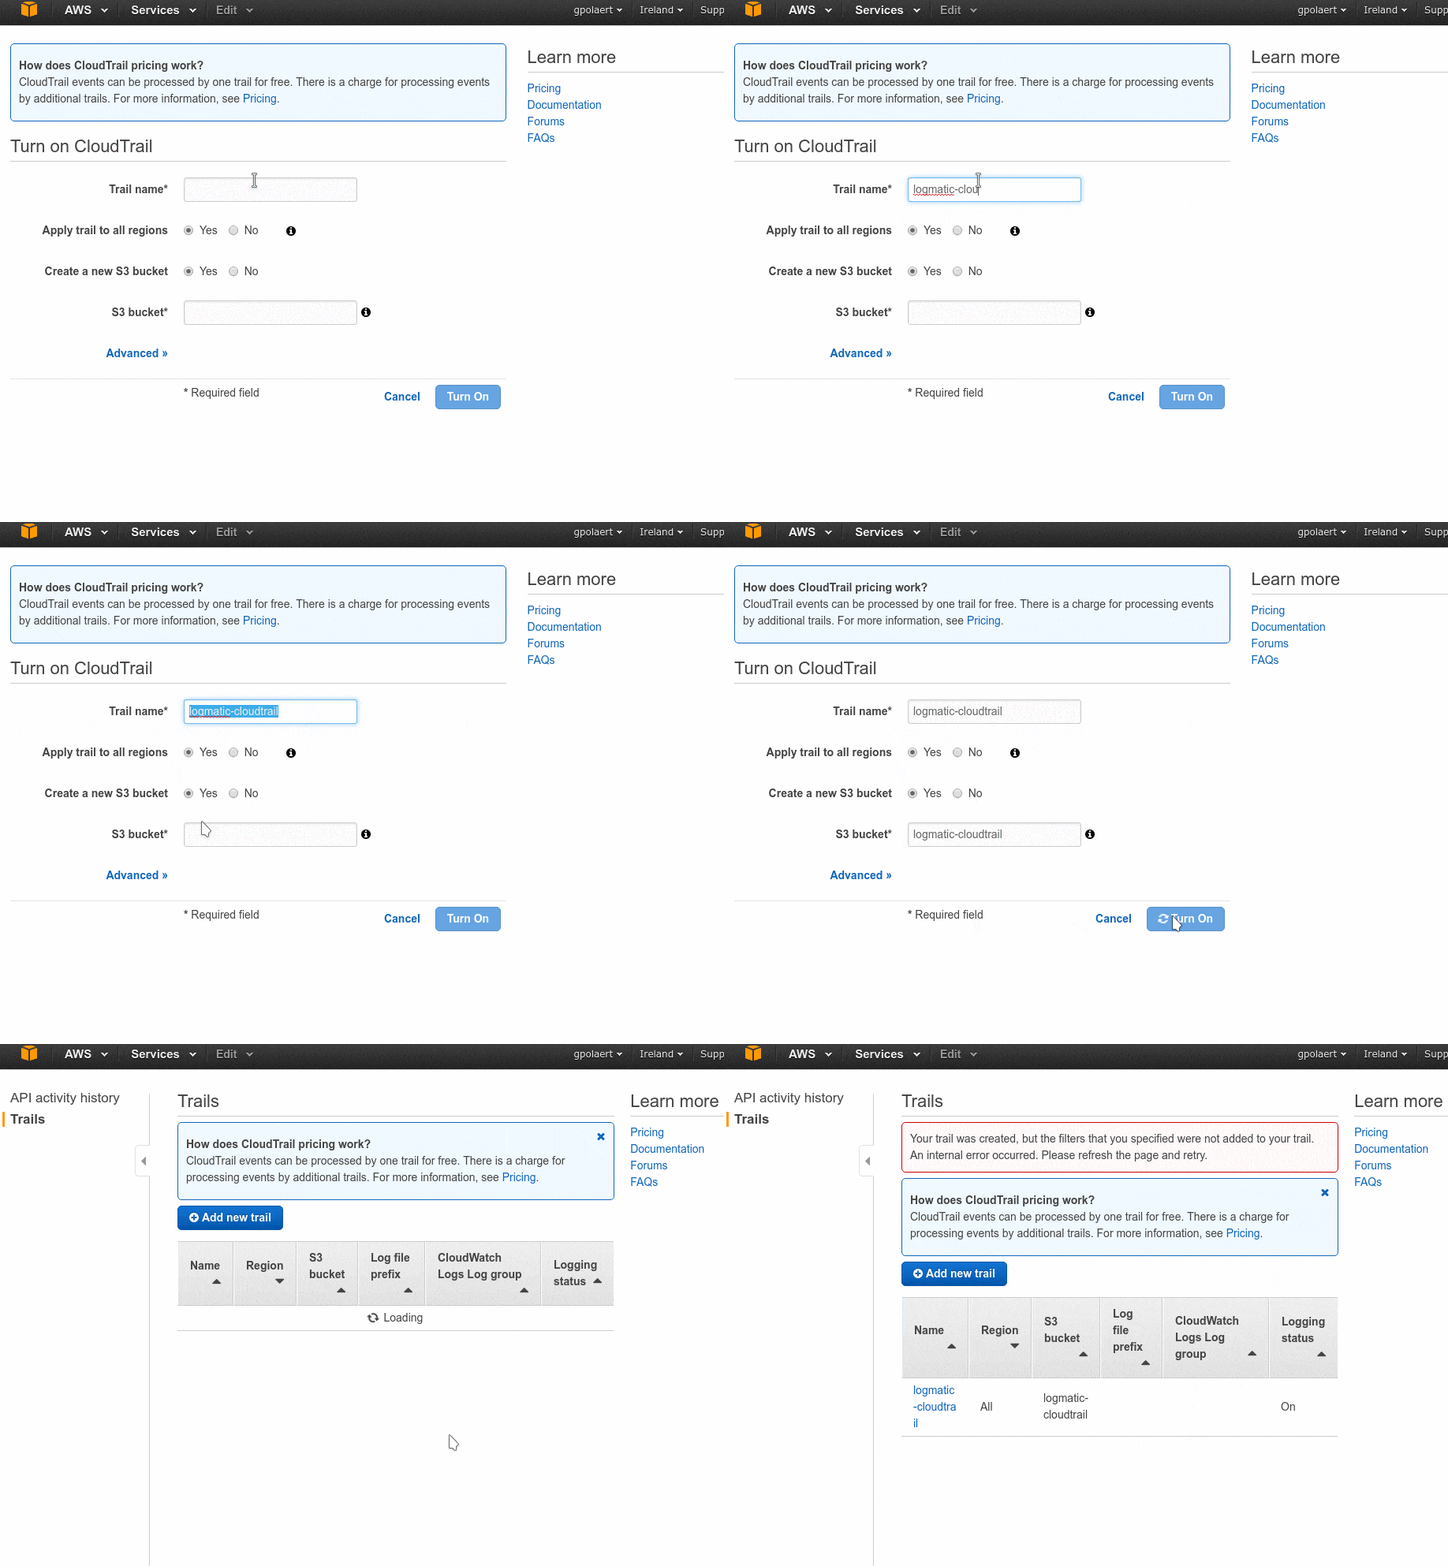
Your CloudTrail can be collected to S3:
- Go to CloudTrail
- Turn on the service as shown on the following animation

Depending on the amount of logs you get and how easily and efficiently you want to read them, get them out and into a log management tool as described in this article S3 access logs section..
V. CloudFront – The AWS’ CDN
CloudFront is a CDN service which speeds up distribution of your static and dynamic web content to your end users, .html, .css, .php and image files for example.
CloudFront delivers your content through a worldwide network of data centers called edge locations. When a user requests content that you’re serving with CloudFront, the user is routed to the edge location that provides the lowest latency (time delay), so content is delivered with the best possible performance.
1) What are CloudFront Logs?
CloudFront Logs are access logs just like the S3 and ELB ones. You can configure CloudFront to create log files that contain detailed information about every user request that CloudFront receives. These access logs are available for both web and RTMP distributions. If you enable logging, you can also specify the Amazon S3 bucket that you want CloudFront to save files in.
Log files are delivered several times per hour and have the following name format:
bucket-name.s3.amazonaws.com/optional-prefix/distribution-ID.YYYY-MM-DD-HH.unique-ID.gzNote however that, even if this is rare, CloudFront logs can sometimes get delayed up to 24 hours. So don’t be worried if it seems that your data isn’t complete.
Here is a sample of the content of a web distribution log file:
Version: 1.0Fields: date time x-edge-location sc-bytes c-ip cs-method cs(Host) cs-uri-stem sc-status cs(Referer) cs(User-Agent) cs-uri-query cs(Cookie) x-edge-result-type x-edge-request-id x-host-header cs-protocol cs-bytes time-taken x-forwarded-for ssl-protocol ssl-cipher x-edge-response-result-type cs-protocol-version2014-05-23 01:13:11 FRA2 182 192.0.2.10 GET d111111abcdef8.cloudfront.net /view/my/file.html 200 www.displaymyfiles.com Mozilla/4.0%20(compatible;%20MSIE%205.0b1;%20Mac_PowerPC) - zip=98101 RefreshHit MRVMF7KydIvxMWfJIglgwHQwZsbG2IhRJ07sn9AkKUFSHS9EXAMPLE== d111111abcdef8.cloudfront.net http - 0.001 - - - RefreshHit HTTP/1.12) Why would you look into CloudFront logs?
CloudFront logs are very useful to monitor the efficiency of the CDN. You can then see response time in every strategic geolocations for your business, how much of the traffic is actually delivered by it, and of course, delivery errors.
3) Enable S3 logging & analyze the data
Here it is again, as for most of AWS logging solutions, your CloudFront logs can be registered into S3:
- Select a distribution and edit it
- Click on the General then on the edit button
- Enable logging (See animated Gif below)
- Choose the S3 bucket destination and prefix

For getting better visibility of those logs and further analytics tips, please refer to the S3 analysis section.
VI. Amazon CloudWatch logs
Amazon CloudWatch is a monitoring service for AWS cloud resources and the applications you run on AWS.
You can use Amazon CloudWatch to collect and track metrics, collect and monitor log files, set alarms, and automatically react to changes in your AWS resources.
1) What are CloudWatch logs?
There is no log for CloudWatch per se: they directly come from your services and applications.
You can then use CloudWatch to centralize your logs and then add a reroute to a S3 bucket for instance.
2) Routing CloudWatch logs to S3
First you need to create the receiving source. We suggest that you use the AWS Lambda function.
You would then need to define a subscription filter. This filtering pattern defines which log events are delivered to your AWS resource and which would not be. It also define where to send matching logs events to:
- Select your log source
- Click on the Actions button, select Stream to AWS Lambda
- Choose the corresponding Lambda function
- Set the log format, you can define a custom format as it’s described in the AWS documentation
- Start streaming

VII. Other AWS services you can get logs from
1) ECS – Amazon EC2 Container Service
Amazon EC2 Container Service (ECS) is a scalable container management service that supports Docker containers. You can run applications on a managed grouping of Amazon EC2 instances.
So the difficulty is in extracting logs from docker containers.
2) SNS – Amazon Simple Notification Service
Amazon Simple Notification Service (Amazon SNS) is a web service that coordinates and manages the delivery of messages to large numbers of subscribing endpoints and clients.
SNS is able to send his logs into S3 buckets
3) OpsWorks – Deployment orchestration
AWS OpsWorks provides a simple and flexible way to create and manage stacks and applications. It provisions AWS resources, manages their configuration, deploys applications to those resources, and monitors their health. AWS OpsWorks is actually a Chef-wrapper.
AWS OpsWorks stores each instance’s Chef logs in the /var/chef/runs directory. To extract logs, you must then deploy a log shipper. We advise to use the one already installed on your linux servers: Rsyslog.
4) VPC – Amazon Virtual Private Cloud
VPC Flow Logs lets you capture information on the IP traffic going to and from network interfaces in your VPC. Flow log data is stored using Amazon CloudWatch Logs. After you’ve created a flow log, you can view and retrieve it in Amazon CloudWatch Logs.
Once logs have fallen into CloudWatch, you can route them into S3 buckets
Wrapping up
With this article we tried to be as exhaustive and synthetic as possible about AWS logging. You probably understood that logging in AWS is a broad topic and that log extraction really depends on the service you’re relying on. But as Amazon leveraged their S3 infrastructure in most cases, with a good solution to get log content out of S3 you can handle pretty much all AWS logging cases.
Important services such as CloudFront, CloudWatch or CloudTrail will be covered in greater details in separate articles. In the meanwhile, It provides a comprehensive overview about how and why collecting your logs is so important. If remote client logging is what matters the most to you, have a quick look at our Android and iOS logging SDKs.


